
Distracted by daily news about big tech stocks, many market observers have lost track of how dramatically value stocks have outperformed growth stocks over the past 12 months.
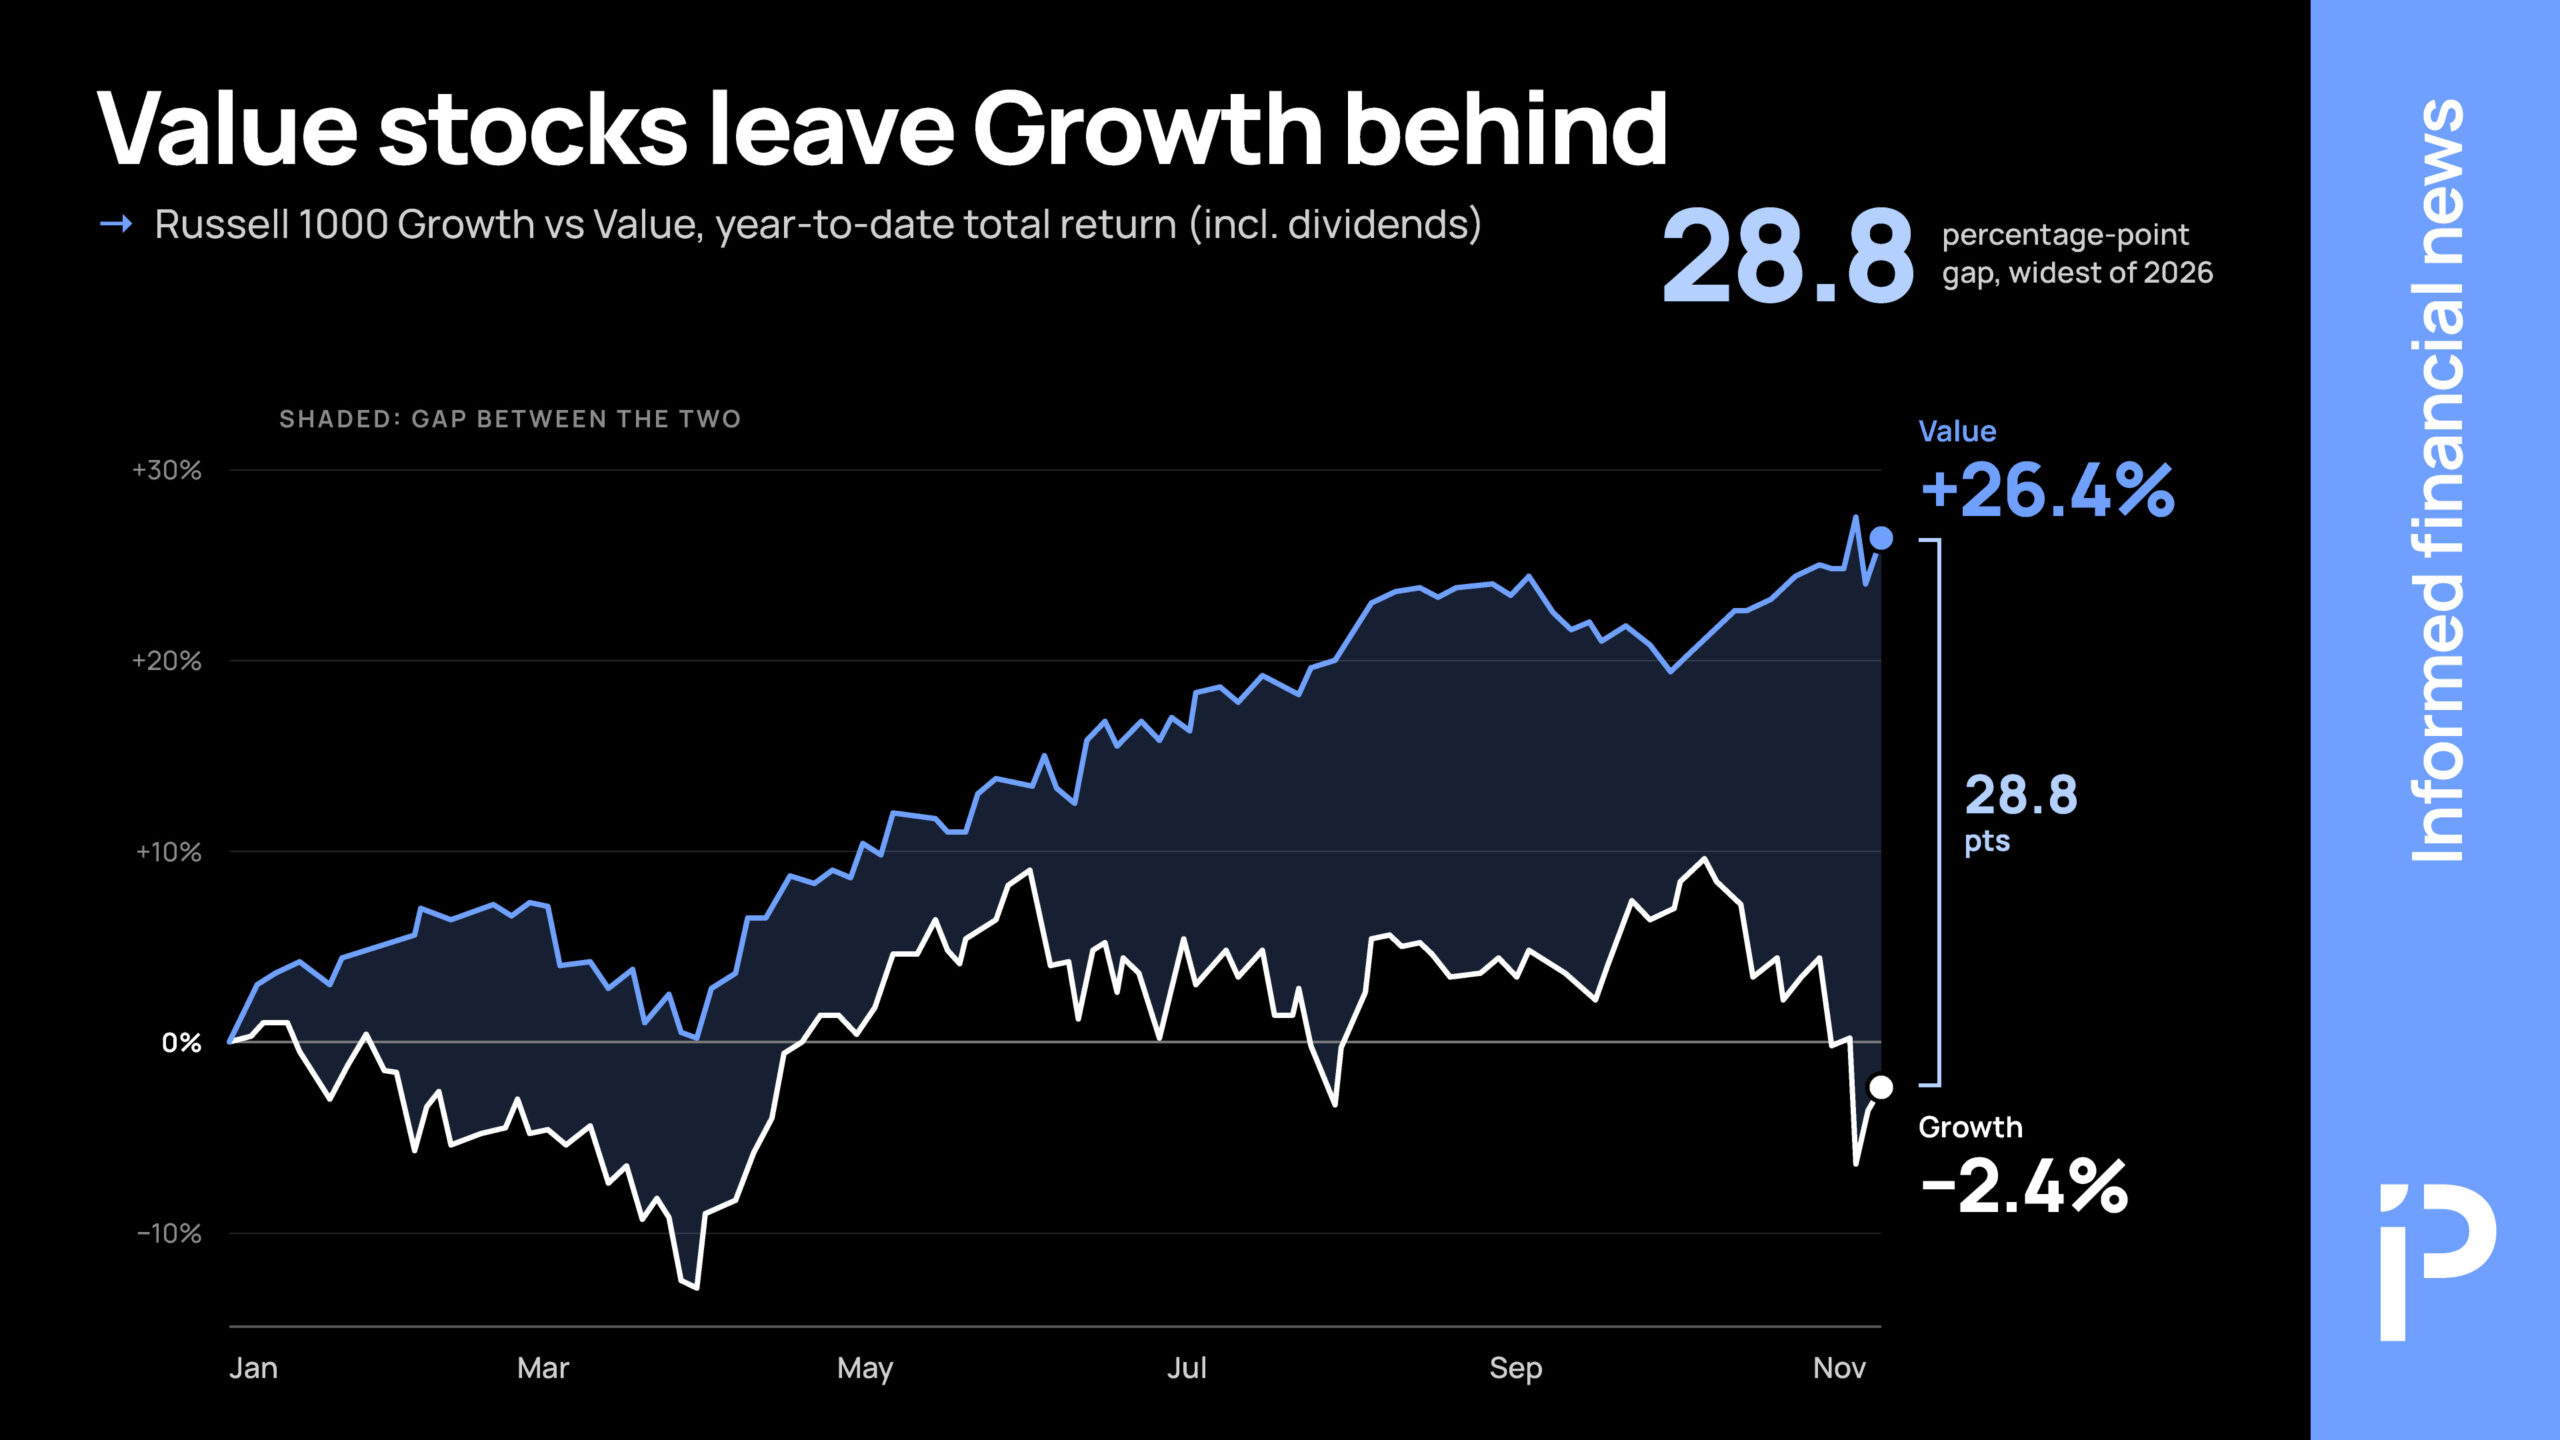
Bluechip growth stocks like Nvidia, Broadcom, and Tesla have actually declined over the past year. Over that same time period, the iShares Russell 1000 Value ETF has rallied, inclusive of dividends, an impressive 29%.
Contrast that undeniably positive return against the iShares’ Russell 1000 Growth ETF, a precise competitor of the Russell’s basket of value stocks, which has lost about 2% of shareholders’ money over the past 12 months.
Pick almost any lookback time frame over recent history — 12-month, year-to-date, or six-month — and baskets of growth stocks have invariably underperformed value stocks.
On a year-to-date basis, growth stocks have underperformed value stocks by approximately 23% or 29 absolute percentage points.
Read more: Can Nvidia fire CEO Jensen Huang over his affair?
Capital rotatation into value stocks
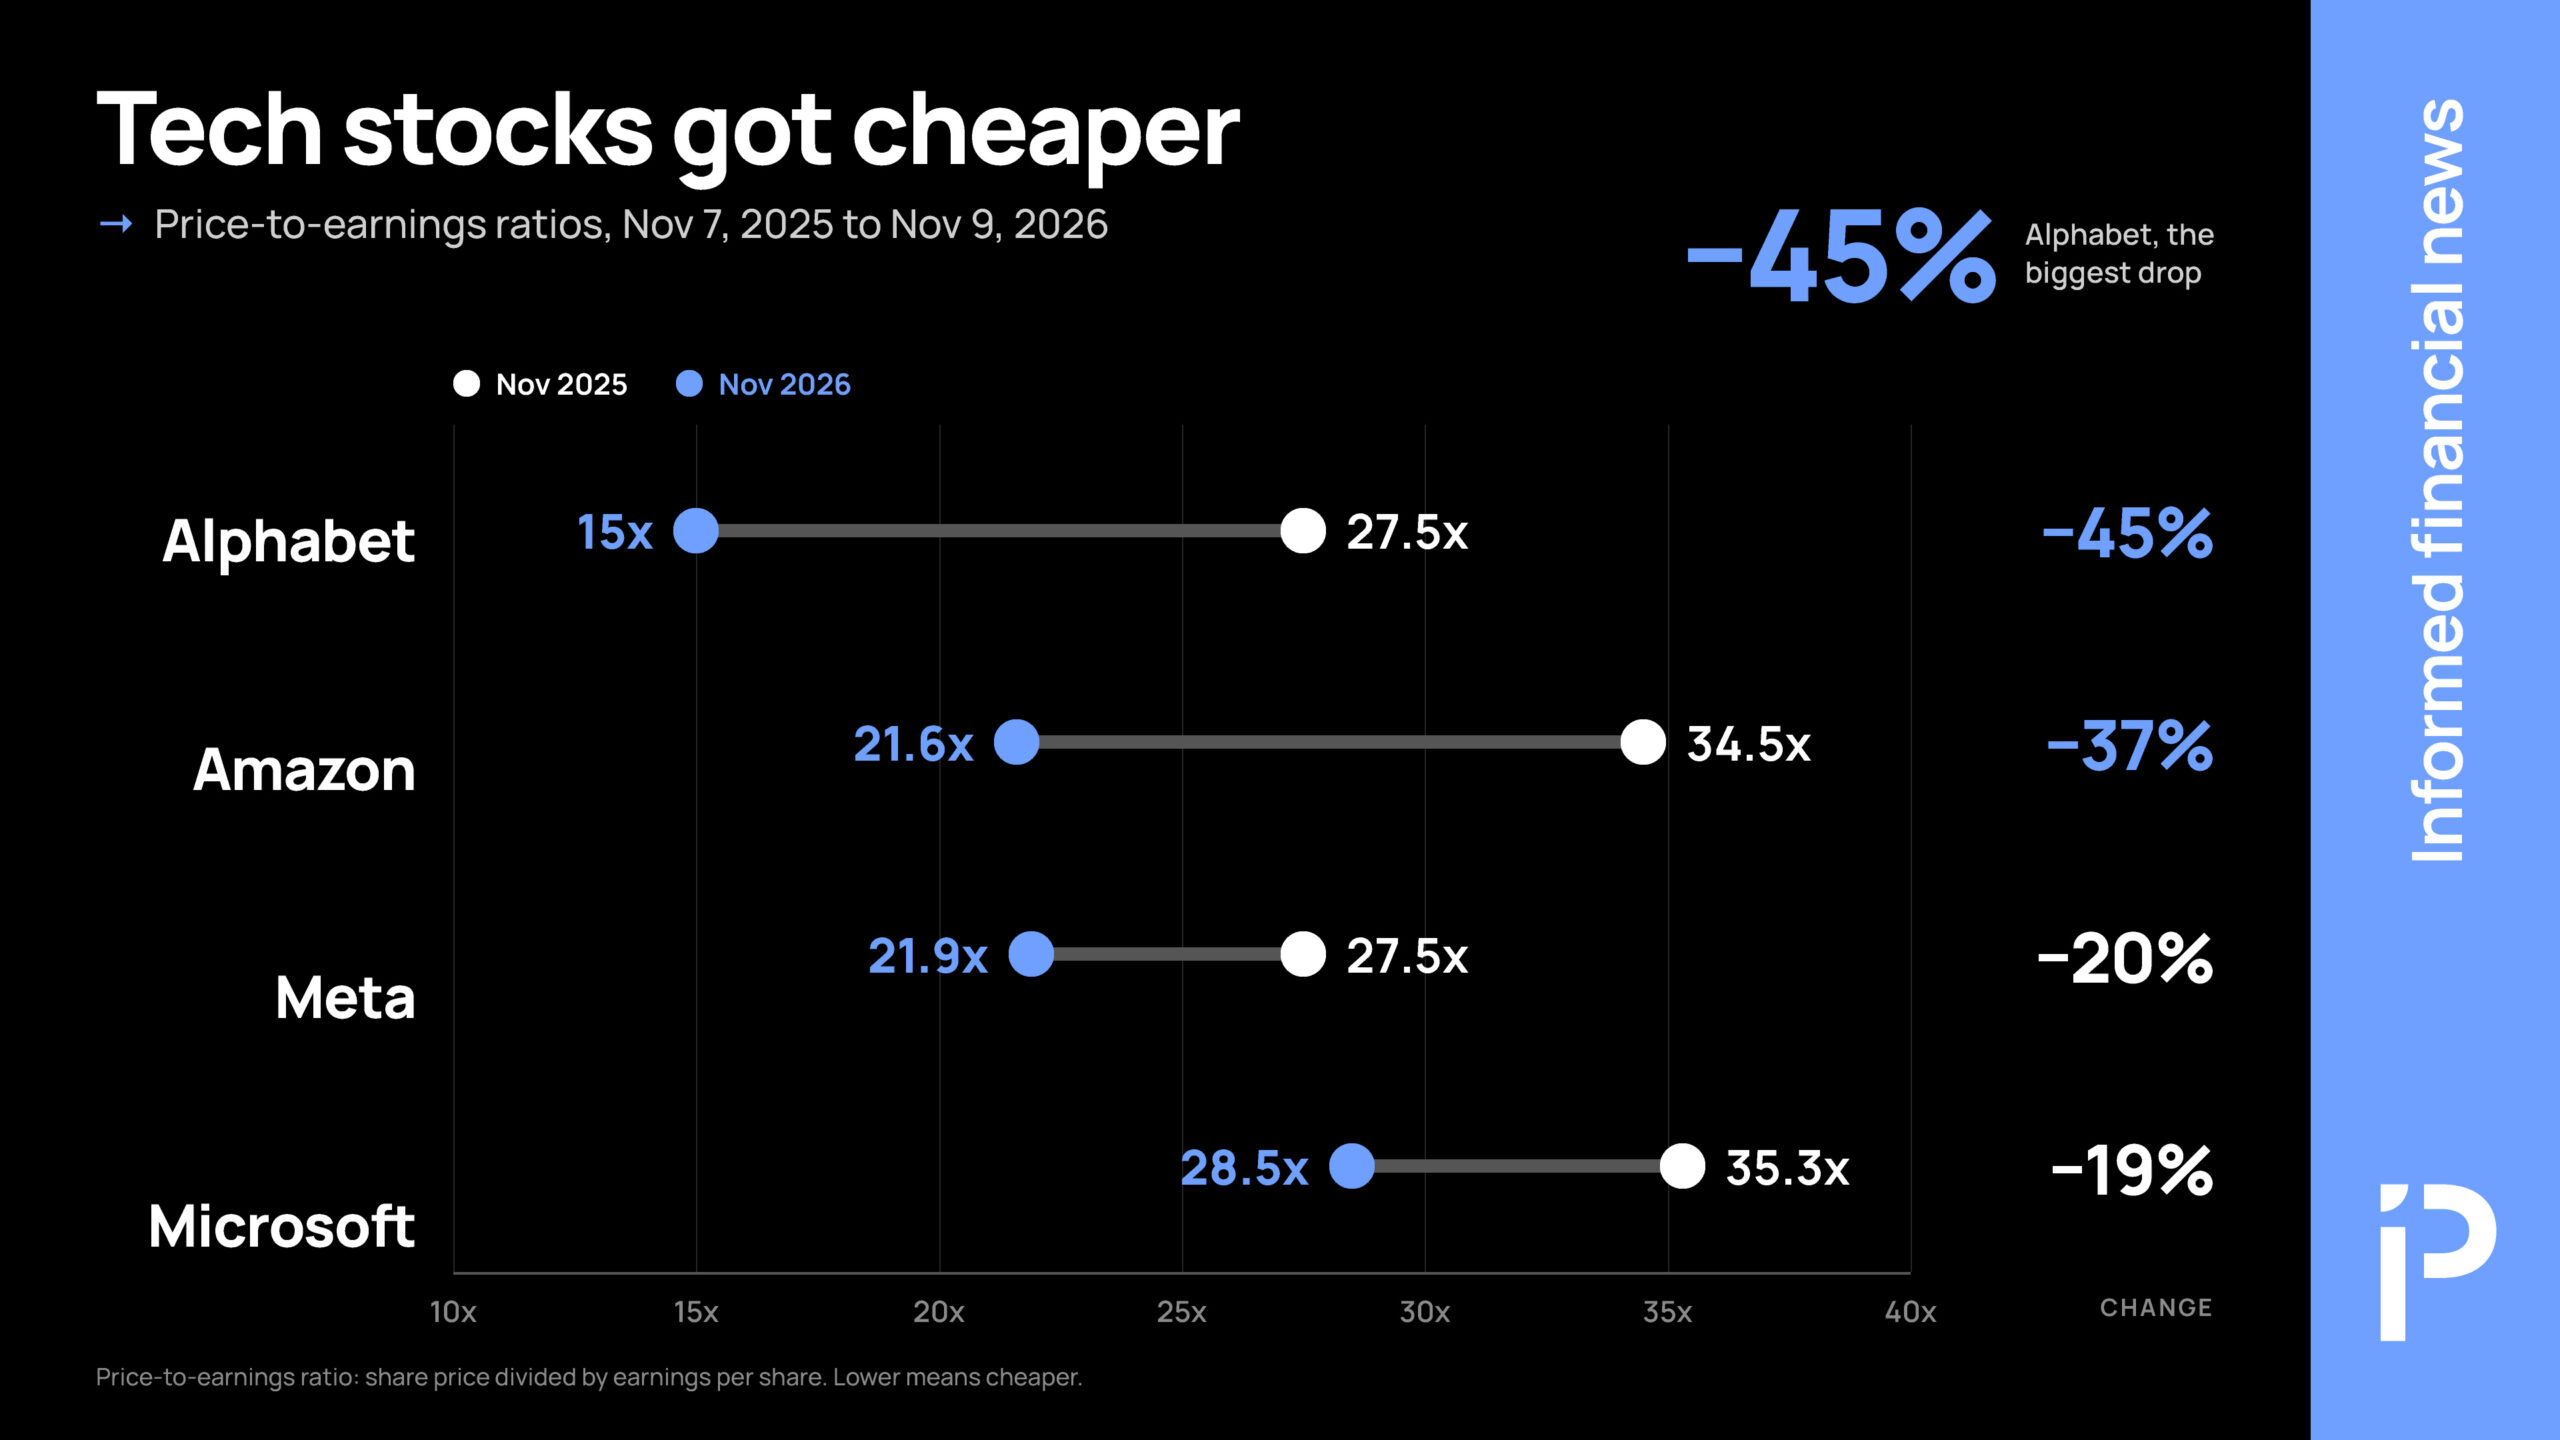
During the past 12 months, the multiple that investors are willing to pay for the trailing 12 months of diluted earnings per share of the biggest tech stocks has dwindled.
Although both the S&P 500 and Nasdaq 100 indices have rallied a bit under 10% over the past 12 months, they’re growing based on total market capitalization — not because investors are paying higher multiples for earnings.
Over the past year, in fact, the S&P 500’s trailing PE ratio fell 13%, from about 25.8x to 22.4x. The average PE of Nasdaq 100 constituents fell by one-fifth, from 33.6x to 27x, over the same time frame.
Individual stocks have fared even worse, with the PE multiple at Amazon down 37% over the past 12 months, and down 45% at Google (Alphabet).
Read more: AI companies rush to borrow cash as stocks crash
Still, the drawdown in growth stocks is a relatively recent phenomenon. A sell-off in AI stocks followed US midterm elections on November 3 that could create regulatory changes.
Some investors feared slower frontier model development or data center construction as a result
Meta spends roughly 43% of its revenue on capital projects, and Microsoft isn’t far behind at 39%. One commentator noted the shift toward AI and data centers, “Big tech is undergoing a fundamental transformation, shifting from asset-light to asset-heavy business models.”
As a result, the market has re-rated those companies. In short, value is back.
Got a tip? Send us an email securely via Protos Leaks. For more informed news and investigations, follow us on X, Bluesky, and Google News, or subscribe to our YouTube channel.