
How bombing Iran shifted oil and bitcoin prices
Since the world learned of massive US military deployments toward Iran on February 18, crude oil has rallied 36%, far surpassing bitcoin’s (BTC) 2.8%.
War-related headlines have definitely affected BTC which, with its 24-hour spot trading venues, has served as a trillion-dollar proxy for risk-on assets.
By charting the price of oil relative to BTC from the de facto start of the war, some of the conflict’s most critical moments become clear.
As a reference price for their pre-wartime starting points, at 12:15am New York time on February 18, BTC traded at $67,833. Oil, specifically contracts for difference (CFDs) on WTI crude, were trading at $62.39 per barrel.
At that time, open-source intelligence accounts began documenting “the largest US Air Force combat buildup in Europe and the Middle East since the Gulf War,” listing dozens of tankers, F-22s, and F-16s repositioning toward the Persian Gulf and Iran.
Chart 1: Price reaction to historic US naval movements toward Iran
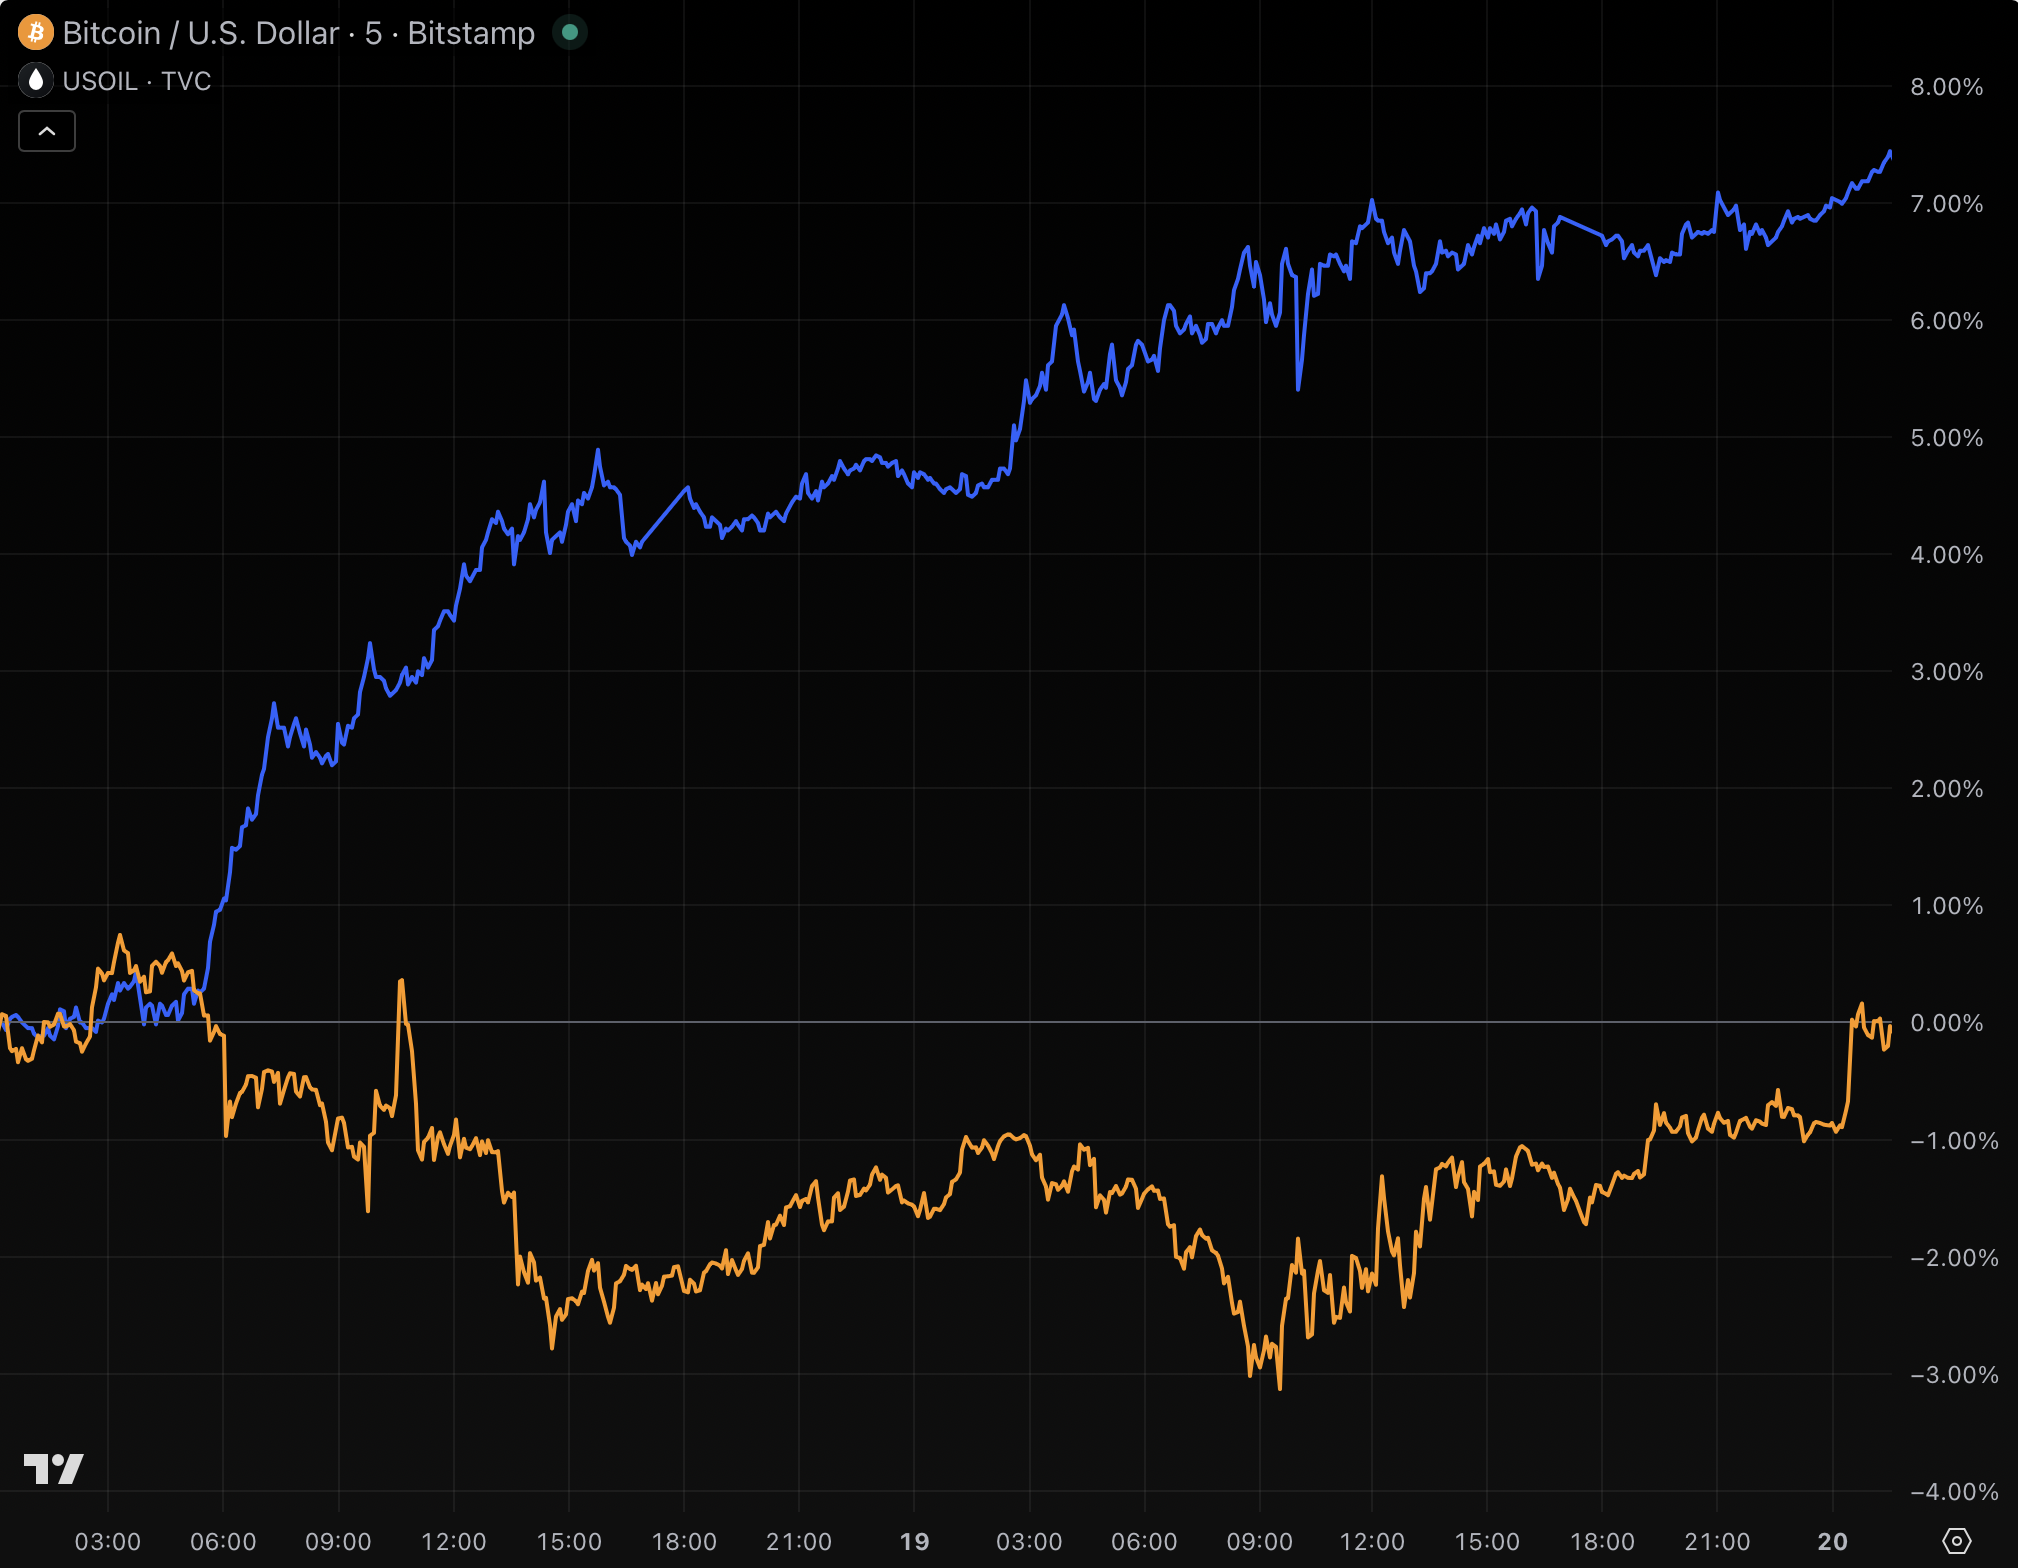
The onset of war became obvious, and oil prices responded to the likelihood of supply restrictions. CFDs for the world’s most-traded and arguably most important commodity rallied without interruption for hours, and by two days later, oil had jumped 7% to $66.76 per barrel.
BTC, meanwhile, barely budged to $67,376, a near-flat 48-hour performance from its $67,833 start.
The divergence in those first 48 hours set the template for what followed.
Oil immediately priced in an imminent kinetic war. BTC did not.
The sophistication of oil traders relative to BTC traders was obvious during those first two days.
Slowly, as anyone should expect from the class of risk-on investments as threats become too obvious to ignore, BTC slid deeper into the red after the initial military buildup reports, hitting a low of $62,525 a week later on February 24, a 7.8% decline from its 12:15am start on February 18.
Oil, in contrast, had already begun a steady climb as more confirmation of military intent trickled into the mainstream news cycle. War was inevitable, and oil traders knew it.
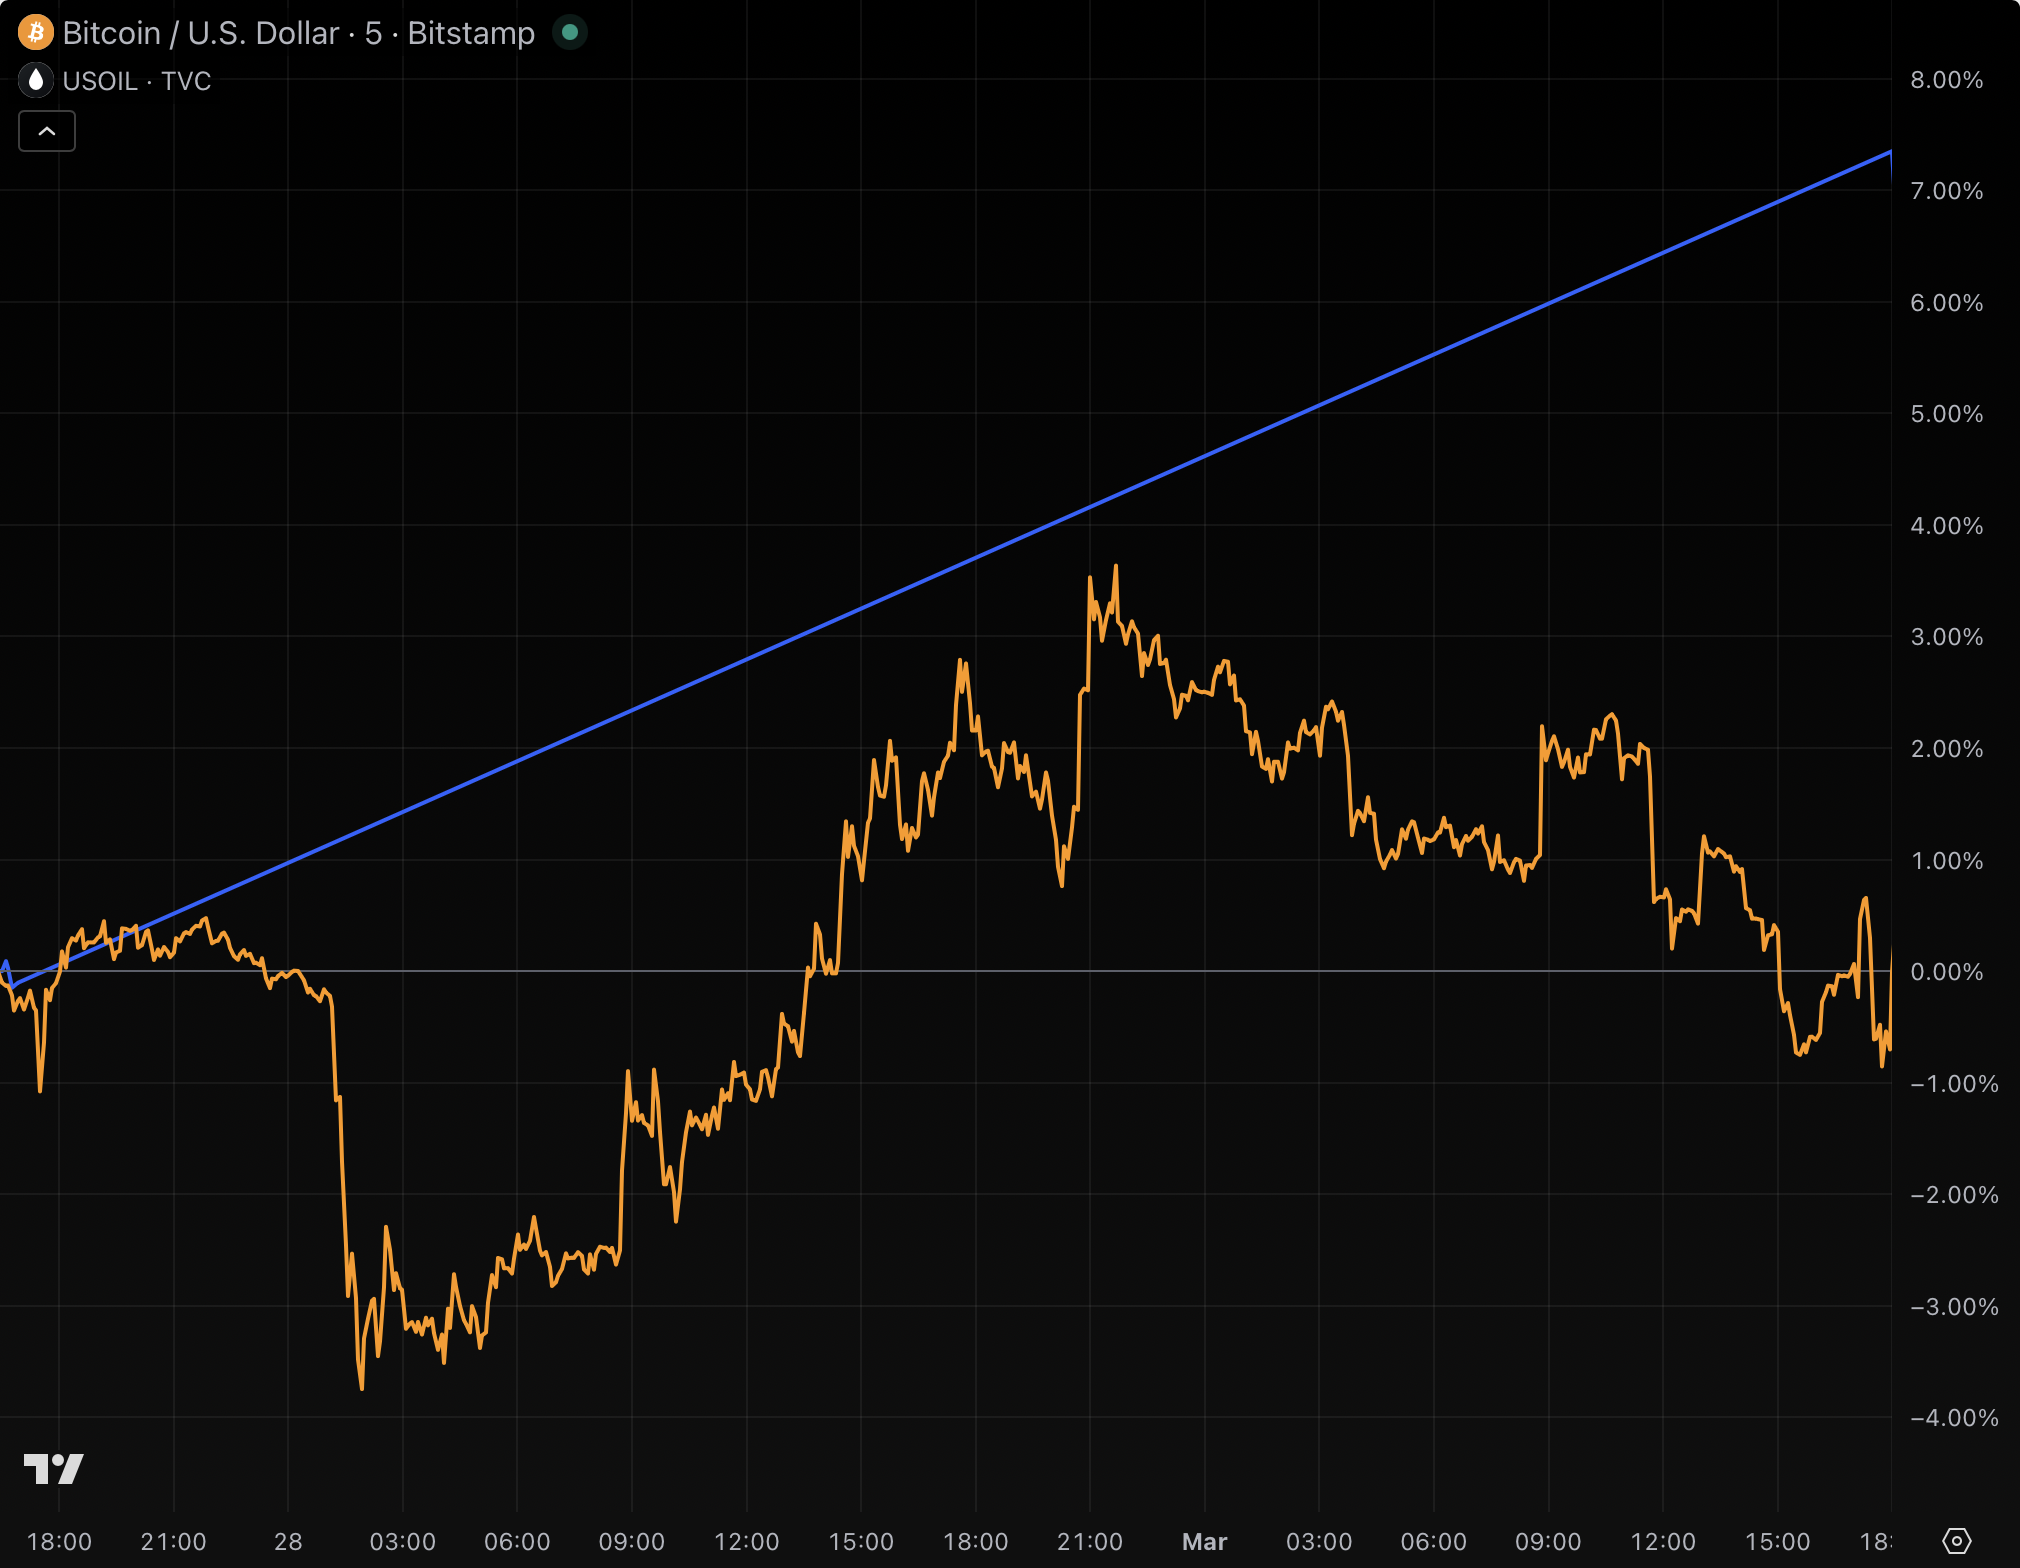
Chart 2: Price reaction to official announcement of war
Finally, at 1:15am New York time on February 28, US and Israeli airstrikes on Iran formally commenced under the banner of “Operation Epic Fury.” Donald Trump announced the operation via Truth Social.
At this time, BTC was trading at $65,492. However, because the announcement fell on a weekend, oil CFDs weren’t open for trading, so there’s no way to know exactly how high oil would have traded.
Unfortunately, the most recent simultaneous price for both assets was February 27 at 5pm New York time: BTC at $65,524 and oil at $67.28 per barrel.
BTC panicked on the initial, formal announcement from Trump. Within 30 minutes, it dropped 3.8% to $63,037. It then recovered.
By Sunday, March 1 at 6pm New York time, when oil CFDs resumed trading, crude had gapped up 11.5% to $75 per barrel.
BTC, at $65,245, remained essentially flat since Trump’s formal announcement.
Oil was already repricing supply disruptions through the Strait of Hormuz, where Iran’s Islamic Revolutionary Guard Corps was threatening to block tanker traffic. BTC wasn’t. It had already sold off slightly from its pre-war, $67,833 start.
Oil surges 91% to $119 per barrel, while BTC recovers its mild loss
The war escalated quickly, sending the price of oil skyrocketing, but risk-on assets soon recovered entirely.
Iran tried to close the Strait of Hormuz, briefly disrupting roughly 20% of global oil supply. Tanker traffic through the chokepoint dropped 81%. Airports and US bases throughout the Middle East took on drone and missile damage.
Oil producers declared force majeure on contracts. Drone strikes hit Saudi Arabia’s largest refinery and Qatari export facilities. Gulf oil production collectively fell by 6.7 million barrels per day by March 10.
Incredibly, oil prices wicked up to $119.48 per barrel at 10:32pm New York time on March 8, a 91.5% surge from its February 18 baseline. BTC peaked much earlier, at $74,075 on March 4 at 2:15pm New York time, for a comparatively modest 9.2% gain.
By 10:40pm New York time on March 10, oil had pulled back 29% from its peak to $84.86 per barrel, partly on comments from Trump suggesting the conflict would resolve “very soon.”
BTC sat at $69,725.
Read more: Bitcoin up, Dubai real estate down since Iran war began
Chart 3: From start to finish, two wildly different returns
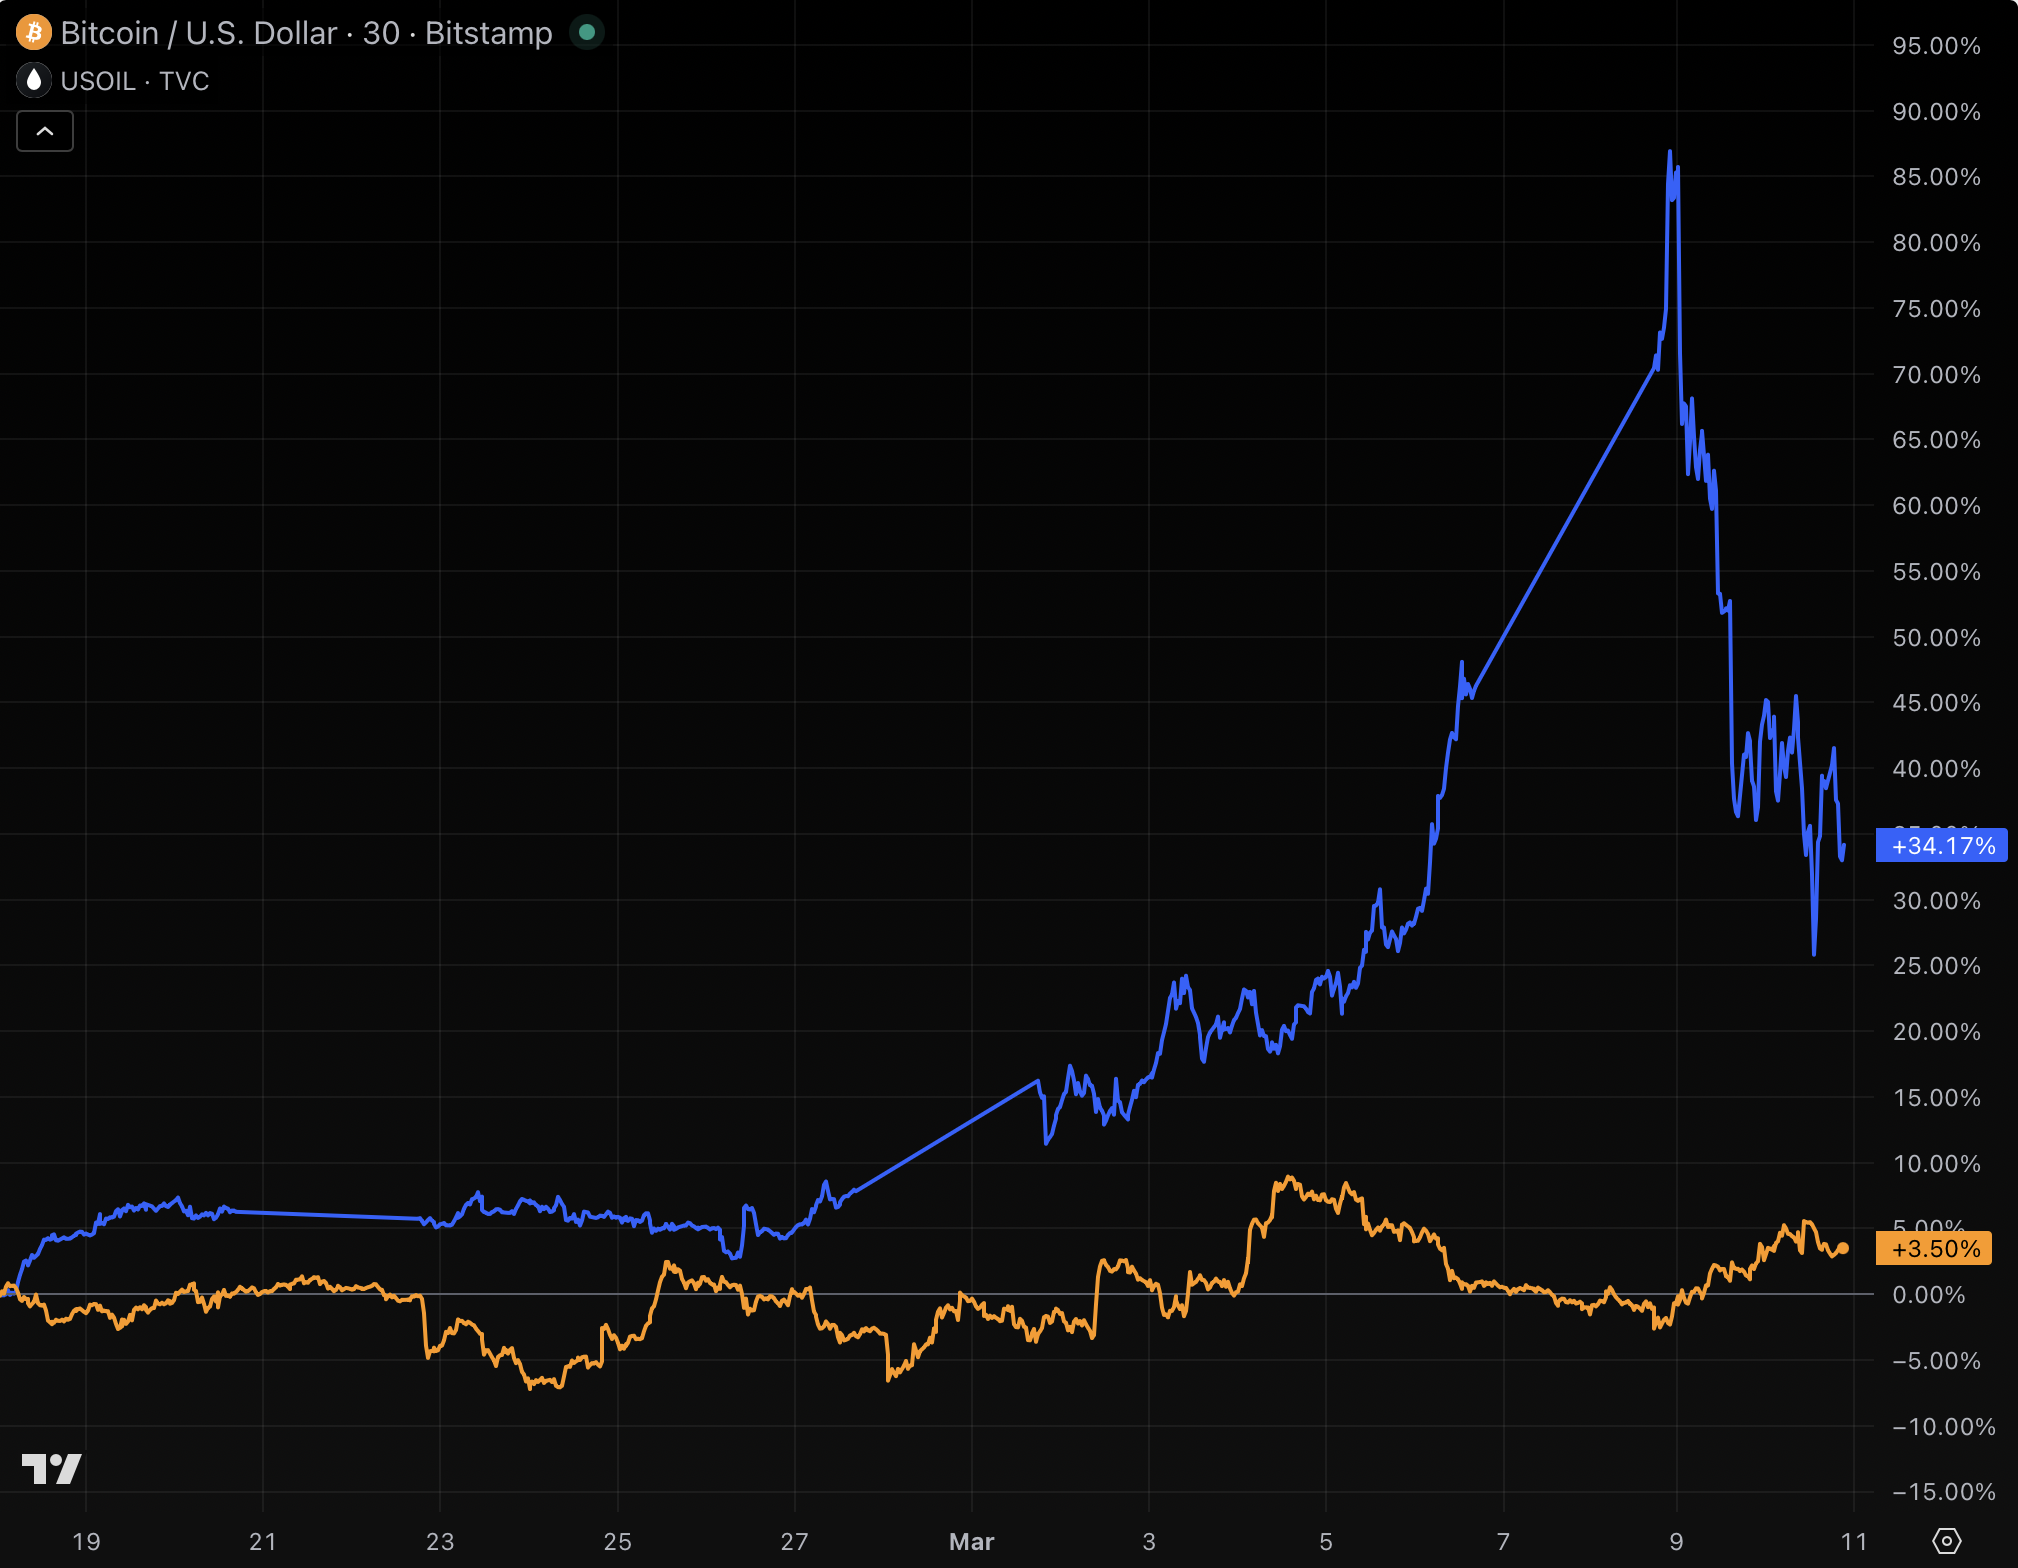
In the roughly three weeks since the start of the war, oil has gained approximately 35% while BTC as a risk-on asset has gained approximately 3%. The above chart illustrates that time period.
Oil’s entire trading range over that time period was $62.39 to $119.48 per barrel. BTC’s range, despite its far smaller size, was a far more conservative $62,525 to $74,075.
One asset reacted to a worldwide a supply shock. The other absorbed headline volatility and largely shrugged it off.
As usual, there are many ways to trade headlines. At least across the opening weeks of this war, oil scarcity has been the bullish trade. BTC was the hold.
Got a tip? Send us an email securely via Protos Leaks. For more informed news, follow us on X, Bluesky, and Google News, or subscribe to our YouTube channel.