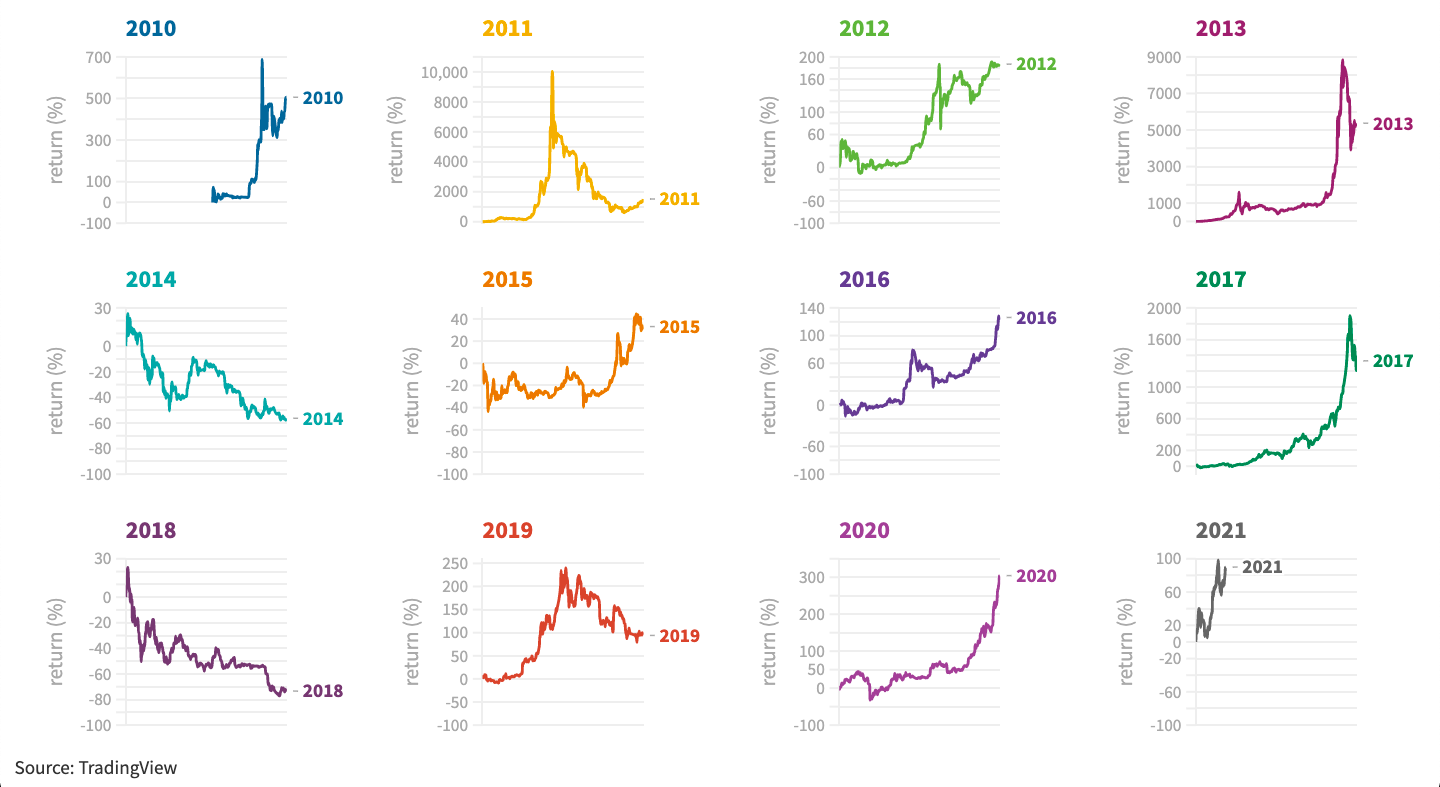
This Bitcoin price index goes back to 2010 — so which year was the most bullish?

TradingView just released a new index that tracks the price of Bitcoin all the way back to 2010.
This is awesome. Until now, it was only really possible to (easily) obtain granular Bitcoin price data until late 2013 — when BTC traded for over $100.
But the question of what happened before that could only really be answered by anecdotes in messy, off-brand Bitcoin wikis.
So, how bullish was Bitcoin exactly in its formative years, and how do they compare to the rallies of 2021?
The chart below plots Bitcoin’s price performance using TradingView’s new index, with each line representing a different year.
- 2013 was Bitcoin’s most bullish year by far — $13.51 to $739.28 (5,370%).
- At 2011’s peak, BTC had surged 10,000% before ‘crashing’ to finish 1,500% up.
- 2017 came third: up 1,900% as BTC neared $20,000 — but 1,330% on Dec 31.
As for how 2021 is stacking up against the past decade, selecting the logarithmic scale on the chart helps show Bitcoin’s comparative performance.
All things considered, Bitcoin is currently outperforming every other year except 2011 and 2013 — however it’s only March (anything could happen).

[Read more: Chasing candles — here’s where Bitcoin’s ‘Tesla pump’ ranks in history]
Turns out, 2018 was the least bullish year for Bitcoin, having collapsed 73% ($13,888 to $3,692).
The only other year on TradingView’s record in which Bitcoin lost value was 2014, when it dropped 56% — from $738 to $322.
Unfortunately, TradingView still doesn’t provide data for 2009 or the first half of 2010.
Still, you can find BTC/USD exchange rates from the very first Bitcoin exchange, NewLibertyStandard, on an old WikiFoundry.
For what it’s worth, Bitcoin finished 2009 in the red by about 8%. But, the exchange rates were mostly calculated manually using electricity bills and not totally by supply and demand.
